Prepare for the AZ-700 Azure Networking exam!

In this post, I’ll tie together the study links from my related YouTube video on the AZ-700 exam topic. You can find the video I produced to help you prepare for this exam at https://aka.ms/YouTube/SC-900. (NOTE: As of 12/19/2021 only the first video in the series has been uploaded. The others will follow, so keep checking back!) The exam objectives which should guide your studying, and which were also used to guide the creation of the content, can be found at Exam AZ-700: Designing and Implementing Microsoft Azure Networking Solutions

As referenced in the introduction of the video, Microsoft MVP, Charbel Nemnom has another study guide with many solid reference links. It can be found at aka.ms/AZ-700StudyGuide.

Here are the slides to use for studying which contain all of the links provided and discussed in the video.

https://aka.ms/AZ-700Deck

Download the deck by clicking on the download icon on the right side, as shown below:

Please let me know if the content helps you pass!

SC-900 Exam Prep Material

In this post, I’ll tie together the study links from my related YouTube video on the SC-900 exam topic. You can find the video I produced to help you prepare for this exam can be found at https://aka.ms/YouTube/SC-900. (Edit 6/28/2021: YouTube video should be available now!) The exam objectives which should guide your studying, and which were also used to guide the creation of the content can be found at Exam SC-900: Microsoft Security, Compliance, and Identity Fundamentals – Learn | Microsoft Docs.

As referenced in the introduction part of the video, Microsoft MVP, Charbel Nemnom has another study guide with many solid reference links which can be found at aka.ms/SC-900StudyGuide.

Here are the slides to use for studying which contain all of the links provided and discussed in the video.

https://aka.ms/SC-900Deck

Download the deck as shown below:

SC-200 Exam Prep Material

I love taking certification exams…don’t you? It’s always fun to test your knowledge and see if you’ve been digging deep enough into the products on a daily basis to really understand them .

In this post, I’ll tie together the study links from my related YouTube video on the SC-200 exam topic. You can find the videos I produced for preparing for this exam at https://aka.ms/YouTube/SC-200. The exam objectives which should guide your studying, and which were also used to guide the creation of the video content can be found at Exam SC-200: Microsoft Security Operations Analyst – Learn | Microsoft Docs.

As referenced in the introduction part of the video, there was already another study guide out there with many solid reference links which can be found at aka.ms/SC-200StudyGuide.

Here are the slides to use for studying which contain all of the links provided and discussed in the video.

https://www.linkedin.com/smart-links/AQEKPGdQrCVGgw

Download the deck as shown below:

I’ll be posting SC-900 exam prep content shortly, so check back in a week or so.

Better Windows Security Logging Using Sysmon

NOTE: Justin Henderson delivers some INCREDIBLE training on SIEM tactical Analysis through SANS. This article is based on some points I learned during that course.

SIEM Training | SIEM with Tactical Analysis | SANS SEC555

As with any SIEM, when it comes to ingesting networking, system or service logs into Azure Sentinel, you have to do more than simply send a large quantity of logs to Sentinel. Pushing gigabytes, terabytes or even petabytes of data into Sentinel creates two challenges:

  • it creates a lot of potential noise for threat hunters to sift through, and
  • storing all that data in Log Analytics can get very expensive, very quickly.

The key then, is to ingest quality logs – logs that will give you the information you need for threat hunting and that will be useful in identifying indicators of compromise. The question we need to address is – how can we do that effectively? There are several excellent strategies for ingesting useful logs from network devices, Linux systems and cloud services, but in this article, I’m only going to address the challenge of logging “interesting” Windows events and sending them to your SIEM.

You Can’t Log Everything

Okay, let’s get something out of the way right now.

If a vendor tells you that their log collection tool or strategy captures ALL the events in Windows, they are…ummm…”stretching the boundaries of believability”. Here’s why.

A given Windows 10 machine, contrary to many people’s expectations, is not an infinitely scalable resource, with no constraints on its processing power or storage capacity. As a result, there are built-in boundaries set on what it can, or is allowed to do. As one simple example, you can’t connect 100 monitors to your laptop and get them all to work.

Those same types of constraints exist for things like event logging. If you go into your Event Viewer tool in Windows 10 and start expanding all the different types of logs, you’ll see that there are more than your standard “System”, “Security” and “Application” logs. For example, on my laptop, I have literally HUNDREDS of things being logged in addition to the 3 major event logs.

Obviously not all of them are logging the same amount of data, but there’s still a lot of logging going on.

So, if you are trying to pull ALL of those logs from a Windows machine, it would require the machine to open up hundreds of individual channels to accommodate all the logs – and that just isn’t going to happen. You will hit your maximum number of 255 channels, and then Windows will politely tell you to take a flying leap…. or Windows may take its own flying leap for you.

So, if we can’t capture ALL the logs in Windows – and we probably don’t need to anyway – how do we capture the stuff that’s important when it comes to threat hunting?

Enter Sysmon…

Sysmon is a free tool, originally developed by the amazing Mark Russinovich and Thomas Garnier, for the Sysinternals suite. You can download sysmon here:

 What makes Sysmon so valuable for threat hunters is that, in contrast to your standard Windows logging in Event Viewer, Sysmon was specifically designed to log activity that is typically associated with abnormal or threat activity. That includes things like:

  • Process creation and access
  • Tracking of network connections
  • Registry additions or modifications
  • Drivers and DLL loading
  • WMI monitoring
  • Modification of file creation times
  • File hashes

…And lots of other similar data.

What’s cool is that Sysmon also generates its own set of event logs and you can configure exactly what gets captured in those logs! Let’s take a look…

Logging Before Sysmon

In the example below, I’ll show you what gets logged on a machine without Sysmon.

Let’s take an example that is a fairly common vector for compromise – an attacker using remote WMI to launch a process on a victim’s machine.

In the screenshot, I’m attacking the machine named VICTIM1721, and the user account is named VICTIM. (I mean really…with a name like that, he was asking for it.) The basic idea is that I run the command below to launch the calculator executable on the victim’s machine.

And as we see from the calculator executable on the VICTIM1721 machine, I was successful.

How very exciting. I can run calculator on the victim machine. What a coup for my team.

Obviously, launching calculator in a visible manner on the victim’s machine isn’t terribly useful for me as an attacker, but it’s illustrating the point that I could launch ANYTHING I WANT on the victim’s machine using WMI if I’ve got the right access. And if I was an attacker, I wouldn’t be launching calculator, and I definitely wouldn’t be launching anything visibly.

As an example, here I’m using WMI to enumerate the groups on my VICTIM machine. That’s information that is VERY interesting to me as an attacker.

So, the question is, what kind of information is provided by Windows for this type of event?

If we look at the Windows Security event logs on the VICTIM1721 machine, we see event ID’s 4624 and 4688, as you see below. There’s some useful information there, such as the fact that a process was created, the time and date of its creation and the fact that it was initiated by NETWORK SERVICE.

Event ID 4624

Event ID 4688

This is reasonably useful information, but there are two problems:

  • the information is contained in two separate events, and
  • there is other information that could help me identify this as anything more than a harmless process being created.

For example, as an attacker, I might choose to launch my malware as a process named svchost.exe. That would rarely even be noticed on a single machine because there’s usually a dozen or more instances of svchost.exe running on a machine at any given time. It would be hard to pick one of them out as being malicious without having some additional context. Additionally, if I look at the “New Process ID” and “Creator Process ID” lines, I see 0x1fe8 and 0xfa4, which isn’t readily usable.

As an aside, during my testing, my machine was being actively attacked externally, as you can see in this event entry. The attacker at IP address 103.119.92.112 tried a number of usernames and passwords against my VICTIM machine, even though it was only publicly accessible for about 4 minutes.

What a world.

Anyway, moving on….

Sysmon-ify Your Logging!

Now let’s add sysmon to the picture. On my VICTIM machine, I’ve downloaded sysmon and installed it according to the default install parameters. That gives me some decent logging capabilities, but I want to enhance the logging. There are a couple great GitHub projects where people have developed comprehensive sysmon configuration files that you can use to customize your logging.

A couple custom logging configs that I like are:

https://github.com/SwiftOnSecurity/sysmon-config

https://github.com/olafhartong/sysmon-modular

What’s very useful about these config files is that they were built with the express intent of logging the actions of known threat actors. They accomplish this by aligning the logging capabilities with the MITRE ATT&CK Framework, in that they look for specific TTP’s (Techniques. Tactics and Procedures) identified in that framework. In the screenshot below, we see a logging configuration defined that is intended to identify actions consistent with T1037 and T1484 from the ATT&CK Framework.

https://attack.mitre.org/techniques/T1037/002/

https://attack.mitre.org/techniques/T1484/

In the repository, there are .XML files that you can download and apply to your own machines to enhance the logging on those machines and dump useful events into the sysmon event logs.

Simply download the XML and run this command (if it’s the first time you’re configuring sysmon):

sysmon.exe -accepteula -i sysmonconfig.xml

If you already have a configuration file for sysmon and want to update that file, run this command:

sysmon.exe -c sysmonconfig.xml

As you see below, I updated the sysmon configuration file on my VICTIM1721 machine.

Once sysmon is installed and starts logging actions, you can find the event log by opening Event Viewer and going to:

Applications and Services Logs – -> Microsoft – – >Sysmon

The Operational Log is where you’ll find the relevant logging for sysmon.

Now if we run the same type of remote WMI command against my VICTIM machine, I can go to my sysmon event logging and see what shows up. In this case, I see something like this in the event:

Notice that the information shown in this event is a little easier to sort through.

  • Time is shown in UTC format – always a valuable data point when investigating issues and trying to correlate events across multiple devices.
  • The Process ID and Parent Process ID are in a human-readable format (8168 and 4004). This will make it a little bit easier to identify the process on the affected machine.
  • Information is provided about the file version of calc.exe and associated hash so I can tell if a file has been modified from its original state.

Additionally, it’s all in a very structured format, which means I can create rules in my SIEM to parse data very easily out of the event.

Now, I can start pulling sysmon information from that Operational log into the SIEM and use that for triggering alerts and incidents.

To be clear, the sysmon Operational log isn’t intended to REPLACE specific logs you may be pulling from machines, such as the security logs or system logs. Those logs still have a value and may capture information not found in sysmon entries.

However, because sysmon was designed to help identify and point a flashlight at anomalies and unexpected behaviors, it can help you to be more efficient in your logging, reduce the overall number of log sources you pull off each machine and help your security team more quickly identify issues that impact the security of your network.

Check out sysmon today!

Using DeTTECT and the MITRE ATT&CK Framework to Assess Your Security Posture

NOTE: Justin Henderson delivers some INCREDIBLE training on SIEM Tactical Analysis through SANS. This article is based on some points I learned during that course.

SIEM Training | SIEM with Tactical Analysis | SANS SEC555

– – – – – – – – – – – – – – – – – –

One of the things I’ve become very interested in lately is the MITRE ATT&CK Framework, which can be found at https://attack.mitre.org. The great thing about this tool is that it provides a real world, standardized method for understanding how adversaries attack specific platform types, including the tactics and techniques they typically leverage, the methods used by specific threat groups and so on.

This is valuable information for understanding the threat landscape and for understanding the way that attackers think. ATT&CK also gives you information about the data sources where you would typically need to look for indicators of compromise related to the types of attacks being carried out. For example, in the screenshot below, you can see that the indicators of compromise (IoC’s) for the “Phishing for Information” technique might be found in logs on your email gateway, your network intrusion detection system, or a packet capture (among other data sources).

This is really good information for understanding what data sources might be useful to look through during an incident, but it leaves one important question unanswered for SOC analysts: am I pulling the right logs into my SIEM (such as Azure Sentinel) in order to detect an adversary that is using a specific tactic?

Using DeTTECT

This is where a tool like DeTTECT, in conjunction with ATT&CK, comes into play.

DeTTECT is an open-source tool, located on GitHub (https://github.com/rabobank-cdc/DeTTECT). Its intent is to help SOC teams compare the quality of their data logging sources to the MITRE ATT&CK matrices in such a way that they can easily see if they have the proper logging coverage to allow them to detect adversaries, based upon the tactics they may be using. What makes DeTTECT so valuable is that it does this in a way that is easily understandable since it is very visual. This can help you understand where you can shore up your organization’s logging for specific types of threats that you may be facing. For example, in the screenshot above, maybe you’re logging traffic on your web proxy, but you aren’t capturing any logging on your email gateway. You could be missing a very valuable source of intelligence in your threat detection by not ingesting those logs into Azure Sentinel. DeTTECT can help you analyze your logging and find those weaknesses. Let’s see how.

The DeTTECT framework uses a Python tool, YAML administration files, the DeTTECT editor and several scoring tables to help you score your environment. The following steps were performed on a Ubuntu VM with the DeTTECT image running inside a Docker container. The instructions for setting up a container running DeTTECT are listed here:

https://github.com/rabobank-cdc/DeTTECT/wiki/Installation-and-requirements

As you see in the following screenshot, I’ve started up the DeTTECT Editor running in the container.

As the last line shows, I can now open the DeTTECT Editor in a URL and begin interacting with the editor. After I bring up the web page, my first step is to add Data Sources. This allows me to define for DeTTECT the logs I am capturing and ingesting into Azure Sentinel so that I can qualitatively measure the visibility I have across my logging sources.

Click on “New File”.

In this case, I want to tell DeTTECT how I’m capturing logs for Windows endpoints, so I click on “Add data source”.

Next, I define the data source as Windows event logs. Notice that the tool provides options for you to choose from as you type. For example, you could select AWS CloudTrail logs, Azure activity logs, Office 365 audit logs and numerous other sources. These options correspond to the logging sources referenced in the MITRE ATT&CK matrices, as we saw earlier.

I add the date the data source was registered and connected, define whether it is available for data analytics and whether it’s been enabled.

Know Thy Data!

Now comes the part where you must know your data. In the next section, I am defining the quality of the data that I’m getting from my Windows event logging configuration. For example, maybe I’m only capturing Windows System logs (reducing my overall visibility). In my example, I’m going to assume that I’m regularly logging data using Sysmon on all my devices, and I ingest it into Azure Sentinel on a regular basis. This gives me great visibility due to the completeness of the data that Sysmon can generate (that’s going to be another blog). I move the bars accordingly.

I go through the same process for all of my data sources, and I end up with something like what you see below.

In a production environment, the list would (hopefully) be much longer, assuming you have more than just a couple logging sources. Note that the quality and coverage of the logging is going to vary according to the system or tool you are evaluating. You may get lots of detailed information from one type of networking device, while another gives fairly limited logging information. Make sure that you reflect that difference in the data sources you add.

Once you’ve added all the data sources for your environment, click on “Save YAML file”.

File Conversion

The next step involves converting the YAML file into JSON, so it can be used in the ATT&CK Navigator tool. Back in the terminal window on my Ubuntu VM, I convert the YAML file into JSON.

The result is shown below:

Layering DeTTECT Data over the ATT&CK Matrix  

Now comes the fun part – seeing how your organization’s data logging sources match up to the ATT&CK Framework. This will give you a visual indicator of how much coverage and visibility you potentially have into different techniques and tactics used by adversaries.

We will be layering our data_sources_example_1.json file (created in the previous section) on top of the MITRE ATT&CK Navigator. First, let’s browse to the MITRE ATT&CK Navigator, located here: https://mitre-attack.github.io/attack-navigator/

I click on Open Existing Layer – – > Upload from Local, and then I browse to the location where I’ve stored my data_sources_example_1.json file.

And *whammo! * – look at the visualization I get!

What Does This Tell Me?

So how do I use this? Think of this as a heat map for logging coverage. The darkest purple boxes reflect the attack techniques that your organization would have the greatest visibility into, based on the quality of the logs you’re ingesting into Sentinel. The lighter the box, the less visibility your organization would have into an attacker using that technique, based on the current logging strategy.

This can be a great way to illustrate to management where you have gaps in your security logging, as it is very easy to understand the color-coding.

More importantly, perhaps, it gives you a starting point for developing a strategy for improving logging capabilities in your organization. As an example, I could look at this and immediately see that my fictional Contoso organization may have a significant amount of exposure, based on the fact that Initial Access – – > Supply Chain Compromise has no logging coverage at all.  

Therefore, I may want to increase my logging in that area of the environment. On the other hand, maybe that’s not an area where Contoso feels they have much of a vulnerability (although I think recent security events should lead Contoso to rethink that position!).

In reality, we are always going to have parts of our environment where the logging is healthy and robust, and we will also have areas where the logging isn’t quite what we would like it to be.

By using a tool like DeTTECT in conjunction with the ATT&CK Navigator, you can begin to prioritize where to increase your logging and continue to improve the security of your organization.

Create a Dynamic Rule Based on User License Plan

One of the great features in Azure AD is the ability to create Office 365 groups based on a set of rules that dynamically query user attributes to identify certain matching conditions. For example, I can create a dynamic membership rule that adds users to an Office 365 group if the user’s “state” property contains “NC”.

1_NCQuery

Pretty simple….

Recently, a partner asked me how they could create a dynamic membership rule that queries for users who have a specific license plan, such as an E3 or E5. It’s easy enough to get that information out of the Office 365 admin portal and create a group with assigned membership (where I statically add them to a group), but they wanted a dynamic group membership rule.

It takes a little work, but it’s not too difficult.

First, the dynamic membership rule must query for something that is unique to the E3 or E5 license plan.

So, once you connect to your tenant using the Azure AD PowerShell module, run the PowerShell script below. This will give you all the SKU’s and SKU ID’s that exist in your tenant.

$allSKUs=Get-AzureADSubscribedSku
$licArray = @()
for($i = 0; $i -lt $allSKUs.Count; $i++)
{
$licArray += “Service Plan: ” + $allSKUs[$i].SkuPartNumber
$licArray +=  Get-AzureADSubscribedSku -ObjectID $allSKUs[$i].ObjectID | Select -ExpandProperty ServicePlans
$licArray +=  “”
}
$licArray

In my case, I see this sort of output for the E5 SKU, indicated by ENTERPRISEPREMIUM as the Service Plan.

Notice the FORMS_PLAN_E5 designation:

2_E5 SKU

A little further down, I see ENTERPRISEPACK as a Service Plan, which indicates an E3 SKU.

Notice the FORMS_PLAN_E3 designation:

3_E3 SKU

For this example, I want a dynamic membership group containing users with an E3 SKU. The FORMS_PLAN_E3 distinguishes those users from the users who have the FORMS_PLAN_E5 SKU, so I can key off that value. I could have selected another SKU with “E3” at the end of the name, but I picked the one for Forms.

Next, I take the SKU ID for the FORMS_PLAN_E3 (beginning with 2789c901-) and make it part of an advanced query, like this:

user.assignedPlans -any (assignedPlan.servicePlanId -eq “2789c901-c14e-48ab-a76a-be334d9d793a” -and assignedPlan.capabilityStatus -eq “Enabled”)

4_DynamicRule

I add it to my advanced rule and click Save.

After a few minutes, the query enumerates the users with the E3 SKU and adds them to the dynamic group.

5_Dynamic membership

What makes this so convenient is that, if later on I license more users with E3, they will be added to the group dynamically as well.

Have fun with your dynamic groups!

Keeping the Lights On: Business Continuity for Office 365

Early in my career at Microsoft, I worked in Microsoft Consulting Services, supporting organizations looking to deploy Exchange 2007 and 2010 in their on-premises environments. During those engagements, the bulk of the conversations focused on availability and disaster recovery concepts for Exchange – things like CCR, SCR and building out the DAG to ensure performance and database availability during an outage – whether it was a disk outage, a server outage, a network outage or a datacenter outage.

Those were fun days. And by “fun”, I mean “I’m glad those days are over”.

It’s never a fun day when you have to tell a customer that they CAN have 99.999% availability (of course – who DOESN’T want five 9’s of availability??) for their email service, but it will probably cost them all the money they make in a year to get it.

Back then, BPOS (Business Productivity Online Service) wasn’t really on the radar for most organizations outside of some larger corporate and government customers.

Then on June 28, 2011, Microsoft announced the release of Office 365 – and the ballgame changed. In the years since then, Office 365 has become a hugely popular service, providing online services to tens of thousands of customers and millions of users.

As a result, more businesses are using Office 365 for their business-critical information. This, of course, is great for our customers, because they get access to a fantastic online service, but it requires a high degree of trust on the part of customers that Microsoft is doing everything possible to preserve the confidentiality, integrity and availability of their data.

A large part of that means that Microsoft must ensure that the impact of natural disasters, power outages, human attacks, and so on are mitigated as much as possible. I recently heard a talk given that dealt with how Microsoft builds our datacenters and account for all sorts of disasters – earthquakes, floods, undersea cable cuts – even mitigations for a meteorite hitting Redmond!

It was an intriguing discussion and it’s good to hear the stories of datacenter survivability in our online services, but the truth is, customers want and need more than stories. This is evidenced by the fact that the contracts that are drawn up for Office 365 inevitably contain requirements related to defining Microsoft’s business continuity methodology.

Our enterprise customers, particularly those from regulated industries, are routinely required to perform business continuity testing to demonstrate that they are taking the steps necessary to keep their services up and running when some form of outage or disaster occurs.

The dynamics change somewhat when a customer moves to Office 365, however. These same customers now must assess the risk of outsourcing their services to a supplier, since the business continuity plans of that supplier directly impact the customer’s adherence to the regulations as well. In the case of Office 365, Microsoft is the outsourced supplier of services, so Microsoft’s Office 365 business continuity plans become very relevant.

Let’s take a simple example:

A customer named Contoso-Med has a large on-premises infrastructure. If business continuity testing were being done in-house by Contoso-Med and they failed the test, they would be held responsible for making the necessary corrections to their processes and procedures.

Now, just because Contoso-Med has moved those same business processes and data to Office 365, they are not absolved of the responsibility to ensure that the services meet the business continuity standards defined by regulators. They must still have a way of validating that Microsoft’s business continuity processes meet the standards defined by the regulations.

However, since Contoso-Med doesn’t get to sit in and offer comments on Microsoft’s internal business continuity tests, they must have another way of confirming that they are compliant with the regulations.

First…a Definition

Before I go much further, I want to clarify something.

There are several concepts that often get intermingled and, at times, used interchangeably: high availability, service resilience, disaster recovery and business continuity. We won’t dig into details on each of these concepts but suffice it to say they all have at their core the desire to keep services running for a business when something goes wrong. However, “business continuity and disaster recovery” from Microsoft’s perspective means that Microsoft will address the recovery and continuity of critical business functions, business system software, hardware, IT infrastructure services and data required to maintain an acceptable level of operations during an incident.

To accomplish that, the Microsoft Online Service Terms (http://go.microsoft.com/?linkid=9840733),which is sometimes referred to as simply the OST, currently states the following regarding business continuity:

  • Microsoft maintains emergency and contingency plans for the facilities in which Microsoft information systems that process Customer Data are located
  • Microsoft’s redundant storage and its procedures for recovering data are designed to attempt to reconstruct Customer Data in its original or last-replicated state from before the time it was lost or destroyed


Nice Definition. But How Do You Do It?

I’ve referenced the Service Trust portal in a few other blog posts and described how it can help you track things like your organization’s compliance for NIST, HIPAA or GDPR. It’s also a good resource for understanding other efforts that factor into the equation of whether Microsoft’s services can be trusted by their customers and partners.

A large part of achieving that level of trust relates to how we set up the physical infrastructure of the services.

To be clear, Microsoft online services are always on, running in an active/active configuration with resilience at the service level across multiple data centers. Microsoft has designed the online services to anticipate, plan for, and address failures at the hardware, network, and datacenter levels. Over time, we have built intelligence into our products to allow us to address failures at the application layer rather than at the datacenter layer, which would mean relying on third-party hardware.

As a result, Microsoft is able to deliver significantly higher availability and reliability for Office 365 than most customers are able to achieve in their own environments, usually at a much lower cost. The datacenters operate with high redundancy and the online services are delivering against the financially backed service level agreement of 99.9%.

The Office 365 core reliability design principles include:

  • Redundancy is built into every layer: Physical redundancy (through the use of multiple disk, network cards, redundant servers, geographical sites, and datacenters); data redundancy (constant replication of data across datacenters); and functional redundancy (the ability for customers to work offline when network connectivity is interrupted or inconsistent).
  • Resiliency: We achieve service resiliency using active load balancing and dynamic prioritization of tasks based on current loads. Additionally, we are constantly performing recovery testing across failure domains, and exercising both automated failover and manual switchover to healthy resources.
  • Distributed functionality of component services: Component services of Office 365 are distributed across datacenters and regions to help limit the scope and impact of a failure in one area and to simplify all aspects of maintenance and deployment, diagnostics, repair and recovery.
  • Continuous monitoring: Our services are being actively monitored 24×7, with extensive recovery and diagnostic tools to drive automated and manual recovery of the service.
  • Simplification: Managing a global, online service is complex. To drive predictability, we use standardized components and processes, wherever possible. A loose coupling among the software components results in a less complex deployment and maintenance. Lastly, a change management process that goes through progressive stages from scope to validation before being deployed worldwide helps ensure predictable behaviors.
  • Human backup: Automation and technology are critical to success, but ultimately, its people who make the most critical decisions during a failure, outage or disaster scenario. The online services are staffed with 24/7 on-call support to provide rapid response and information collection towards problem resolution.

These elements exist for all the online services – Azure, Office 365, Dynamics, and so on.

But how are they leveraged during business continuity testing?

Each service team tests their contingency plans at least annually to determine the plan’s effectiveness and the service team’s readiness to execute the plan. The frequency and depth of testing is linked to a confidence level which is different for each of the online services. Confidence levels indicate the confidence and predictability of a service’s ability to recover.

For details on the confidence levels and testing frequencies for Exchange Online, SharePoint Online and OneDrive for Business, etc… please refer to the most recent ECBM Plan Validation Report available on the Office 365 Service Trust Portal.

BC/DR Plan Validation Report – FY19 Q1

A new reporting process has been developed in response to Microsoft Online Services customer expectations regarding our business continuity plan validation activities. The reporting process is designed to provide additional transparency into Microsoft’s Enterprise Business Continuity Management (EBCM) program operations.

The report will be published quarterly for the immediately preceding quarter and will be made available on the Service Trust Portal (STP). Each report will provide details from recent validations and control testing against selected online services.

For example, the FY19 Q1 report, which is posted on the Service Trust Portal (ECBM Testing Validation Report: FY19 Q1), includes information related to 9 selected online services across Office 365, Azure and Dynamics, with the testing dates and testing outcomes for each of the selected services.

The current report only covers a subset of Microsoft cloud services, and we are committed to continuously improving this reporting process.

If you have any questions or feedback related to the content of the reporting, you can send an email to the Office 365 CXP team at cxprad@microsoft.com.

Additional Business Continuity resources are available on the Trust Center , Service Trust Portal, Compliance Manager and TechNet

  1. Azure SOC II audit report:  The Azure SOC II report  discusses business continuity (BC) starting on page 59 of the report, and the auditor confirms no exceptions noted for BC control testing on page 95.
  2. Azure SOC Bridge Letter Oct-Dec 2018 : The Azure SOC Bridge letter confirms that there have been no material changes to the system of internal control that would impact the conclusions reached in the SOC 1 type 2 and SOC 2 type 2 audit assessment reports.
  3. Global Data Centers provides insights into Microsoft’s framework for datacenter Threat, Vulnerability and Risk Assessments (TVRA)
  4. Office 365 Core – SSAE 18 SOC 2 Report 9-30-2018: Similar to the Azure  365 SOC II audit report (dated 10/1/2017 through 9/30/2018) discusses Microsoft’s position on business continuity (BC) in Section V, page 71 and the auditor confirms no exceptions noted for the CA-50 control test on page 66.
  5. Office 365 SOC Bridge Letter Q4 2018 : SOC Bridge letter confirming no material changes to the system of internal control provided by Office 365 that would impact the conclusions reached in the SOC 1 type 2 and SOC 2 type 2 audit assessment reports.
  6. Compliance Manager’s Office 365 NIST 800-53 control mapping provides positive (PASS) results for all 51 Business Continuity Disaster Recovery (BCDR)-related controls within Microsoft Managed Controls section, under Contingency Planning. For example, the Exchange Online Recovery Time  Objective and Recovery Point Objective (EXO RPO/RTO) metrics are tested by the third-party auditor per NIST 800-53 control ID CP2(3). Other workloads, such as SharePoint Online, were also audited and discussed in the same control section.
  7. ISO-22301  This business continuity certification has been awarded to Microsoft Azure, Microsoft Azure Government, Microsoft Cloud App Security, Microsoft Intune, and Microsoft Power BI. This is a special one. Microsoft is the first (and currently the ONLY) hyperscale cloud service provider to receive the ISO 22301 certification, which is specifically targeted at business continuity management. That’s right. Google doesn’t have it. Amazon Web Services doesn’t have it. Just Microsoft.
  8. The Office 365 Service Health TechNet article provides useful information and insights related to Microsoft’s notification policy and post-incident review processes
  9. The Exchange Online (EXO) High Availability TechNet article outlines how continuous and multiple EXO replication in geographically dispersed data centers ensures data restoration capability in the wake of messaging infrastructure failure
  10. Microsoft’s Office 365 Data Resiliency Overview outlines ways Microsoft has built redundancy directly into our cloud services, moving away from complex physical infrastructure toward intelligent software to build data resiliency
  11. Microsoft’s current SLA commitments for online services
  12. Current worldwide up times are reported on Office 365 Trust Center Operations Transparency
  13. Azure SLAs and uptime reports are found on Azure Support

As you can see, there are a lot of places where you can find information related to business continuity, service resilience and related topics for Office 365.

This type of information is very useful for partners and customers who need to understand how Microsoft “keeps the lights on” with its Office 365 service and ensures that customers are able to meet regulatory standards, even if their data is in the cloud.


Requesting a FINRA/SEC 17a-4 Attestation Letter for Office 365

One of the strengths of Microsoft’s cloud services is the deep and broad list of technical certifications that the services have achieved. These include various common standards, such as SOC I and II, and SSAE. Additionally, Microsoft meets various country-specific government standards, such as FedRAMP.

But before we go any further, it’s important to make a distinction between a “certification” and an “attestation”, because they sometimes get used interchangeably when referring to Office 365 compliance.

  • Certifications are industry standards, such as ISO and SOC that are audited by a 3rd party. Microsoft is required to operate their datacenters and services according to those audited standards.
  • Attestations, on the other hand, are more like 3rd party guidance, or opinions, related to specific regulations. They are reference documents created by a 3rd party that say, “Yes, the necessary controls exist in Office 365 so that you can configure your tenant to meet a given regulation.” For example, it could be HIPAA for medical and health customers, FERPA for education or FINRA for the financial industry. These attestations often provide implementation guidance, but the important point here is that the responsibility is on the customer to configure the controls in the tenant to meet the regulation. What the attestation does is confirm that the necessary controls exist in Office 365 that will allow the customer to meet that regulation.

The point of these certifications and attestations is not simply to be able to tick a checkbox on an RFP. Rather, these certifications and attestations form a foundation of trust that helps assure customers that their data, identities and privacy is being handled in a responsible way, according to a set of standards defined outside of Microsoft.

There are numerous resources a customer or partner can go to and get information about specific compliance requirements, but sometimes it can be hard to track down exactly what you’re looking for – simply because there is SO MUCH information and it’s categorized and stored in different locations.

Take for example, the SEC 17a-4 letters of attestation, which are often referred to as the FINRA attestation letters. To be clear, SEC 17a-4 is the regulation, whereas FINRA is actually the agency that enforces the regulation. (Yes, the SEC is also an enforcement agency, but let’s not muddy the waters.) These letters may be required by a customer to confirm that Office 365 meets certain regulations of the Financial Industry Regulatory Agency (FINRA) in the United States.

Since neither the customer nor the SEC have direct access to the Office 365 cloud environment, Microsoft bridges the gap through these letters of attestation to the SEC on behalf of the requesting customer.

These letters affirm, among other things, that the Office 365 service – and specifically the Immutable Storage for Azure Blobs that are the underpinnings of the Office 365 storage services – can be leveraged by the customer to preserve their data on storage that is non-rewriteable and non-erasable.

The next question is – where can a customer get that letter? Let’s talk for a moment about the various resource locations available for a customer to review to find the information they might require. (You can also skip straight to the end to get the answer about FINRA, but you’ll miss some interesting stuff.)

Trust Center
The Trust Center Resources are located at https://www.microsoft.com/en-us/trustcenter/resources

Here, you can use the drop-down selections to find articles, blogs, whitepapers, e-books, videos, case studies and other resources related to Microsoft’s compliance to different types of regulatory standards.

For example, in the screenshot below, I’ve narrowed my search down to any type of resource related to the financial industry in North America related to compliance in Office 365. The result is a single document, named IRS 1075 backgrounder.

1_TrustCenter

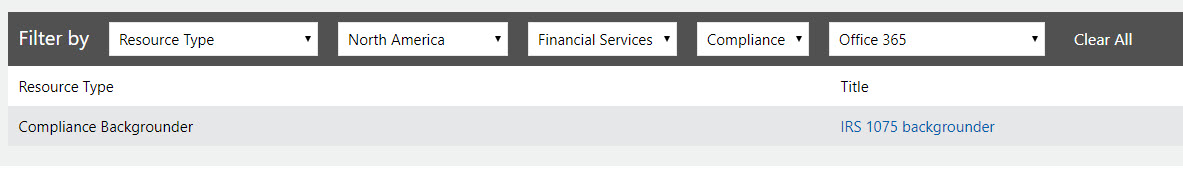
That’s probably interesting in a different scenario, but it’s not a FINRA attestation letter, so it won’t help me in this instance.

Let’s dig some more…

Office 365 Security and Compliance Center

The next place I might look is the Office 365 Security and Compliance Center. I can get to this location in my Office 365 tenant (whether it’s a paid or a demo tenant) by going to my Admin portal, then to Admin centers, and then Security & Compliance.

Under the Service assurance section, I click on Compliance Reports.
2_ComplianceReports

From here, I have the ability to sort my reports according to the type of reporting I’m interested in, such as FedRAMP (for US federal government customers) and GRC (which simply means Governance, Risk and Compliance) and others.

For your reference, the same documents are available in the Trust Center here: https://servicetrust.microsoft.com/ViewPage/MSComplianceGuide

In looking through these documents, there is plenty to see, but nothing that specifically references FINRA.

Let’s look at the next blade – Trust Documents.

3_TrustDocuments

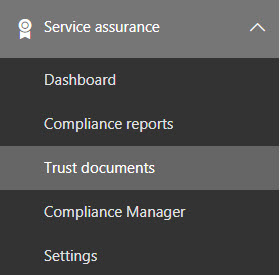
The default section that opens is a list of FAQs and Whitepapers, but the second section on the page is Risk Management Reports. This includes results of penetration testing and other security assessments against the cloud services, but again, no attestation letters.

4_PenTest

The last section to click on is Compliance Manager.

4.5_CompMgr

The Compliance Manager tool can be accessed at any time by going to https://servicetrust.microsoft.com/ComplianceManager and logging in with your Office 365 credentials.

In Compliance Manager, you can track your organization’s level of compliance against a given regulation, such as GDPR, FedRAMP or HIPAA. I won’t go into a lot of detail about Compliance Manager here, but the basic idea is that you define the service you are interested in evaluating and the certification you’re interested in, as seen in the screenshot below.

5_ComplianceMgr

As an example, let’s select HIPAA.

What I see now is a gauge that shows how far along my organization is in implementing all the controls related to HIPAA. Some of these controls are managed by Microsoft (such as those related to datacenter security) and others are managed by the customer (such as the decision to encrypt data).

6_HIPAAGauge

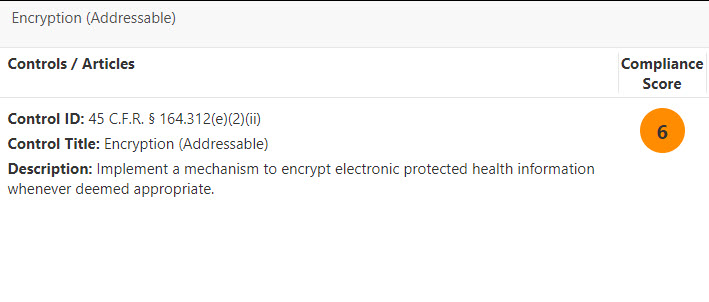
First, I see the actual control ID, title and a description of the control, as it is defined in the HIPAA documentation. This allows me to get a quick overview of the regulation itself.

7_HIPAAControl

You can also see information about how you could meet the requirements for this control using Microsoft products. The screenshot below shows how Azure Information Protection and Customer Managed Keys in Office 365 could help you meet the requirement for this HIPAA control.

8_HowToDoIt

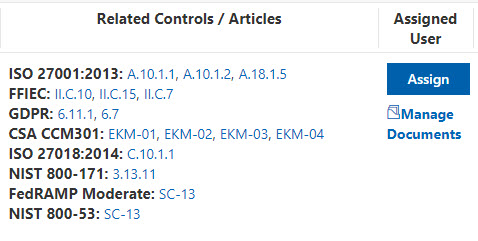
Next, I see a list of related controls, so that, if there are areas of overlap, I don’t necessarily need to spend a lot of time and effort planning how to implement this control. For example, in the screenshot below, if my organization has already configured the controls for ISO 27018:2014: C.10.1.1, then I can simply verify that this would also meet the HIPAA control listed in the screenshot above.

9_RelatedControls

I can then use the last section to provide my supporting documentation and the date of my validation testing, along with the test results.

10_ProjectMgmt

Compliance Manager is a powerful tool for tracking your adherence to certain regulations, but it’s still not a FINRA attestation letter.

FINRA Attestation Letter Process

The actual process for requesting a FINRA attestation letter is not very complicated at all. Go back to your main Office 365 Admin portal page and open a New service request under the Support section.

11_SupportTicket

You can choose to submit a “New service request by email”, ensuring that “FINRA attestation letter” is noted at the beginning of your documentation.

The support engineer who gets the ticket will be directed to pass this along to an escalation team.

Based upon the information exchanged with the customer, the escalation team will engage CELA (Microsoft’s legal group) and they will get the attestation letter generated and executed. The final letter will look somewhat similar to this, but the highlighted areas will have the actual customer name and address.

12_FINRALetter

Note that this process carries a 10-day SLA.

When the support ticket has been opened the support engineer will provide the information shown below, and then they will work with the customer to collect specific tenant-level information that ensures the accuracy of the prepared document.

Microsoft’s position, confirmed by is that Office 365 provides administrators with configuration capabilities within Exchange Online Archiving to help customers achieve compliance with the data immutability and data storage requirements of SEC Rule 17a-4. 

 The Azure external review confirms the ability for customers to achieve compliance with the data immutability and data storage requirements of SEC Rule 17a-4.

 Microsoft actively seeks to help our customers achieve compliance with the many and varied regulatory requirements found in domestic and international jurisdictions. That said, it is important to note that while Microsoft will do all we can to assist, Microsoft itself is a not a regulated entity and does not directly comply with the SEC 17a-4 regulation.

 Financial services firms are the regulated entities and as such remain responsible for direct compliance with the applicable rules when using Microsoft technologies. Due to the many variances within customer environments, financial services firms themselves need to ensure all appropriate steps have been taken to meet the regulatory requirements, including using Microsoft’s online services appropriately and training employees to do the same.

Microsoft has published the blog, Office 365 SEC 17a-4 , which offers customer-ready information along with the capability to download our whitepaper.   

The SEC 17a-4 requires the regulated entity to secure a secondary resource to provide the archived data to the SEC upon request, should the regulated entity not be able or willing to provide the data to the SEC directly.  Microsoft will provide data to the SEC under the terms of the regulation for Office 365 customers who remain actively licensed for the service. Data for customers who exit the service will only be retained per the current data retention policies.  Microsoft will attest to meeting SEC requests for data by providing customers with the required Letter of Undertaking, addressed to the SEC and referencing the regulated entity. This letter is described within the regulation, under section 17a-4(f)(3)(vii).

The SEC 17a-4 also requires the regulated entity to attest to the immutability, quality, formatting and indexing of the archived data. This requirement is referred to as Electronic Storage Medium (ESM) Representation under section 17a-4(f)(2)(i). Microsoft will attest to the ESM capability by providing customers with the required Letter of Attestation, Electronic Storage Media Services, addressed to the SEC and referencing the regulated entity.

Hopefully, this information helps you as you work to meet FINRA compliance requirements in your Office 365 tenant.

UPDATE: On January 28, 2019, Microsoft published an article describing how Exchange Online and the Security and Compliance Center can be used to comply with SEC Rule 17a-4.

The article includes a link to the Cohasset assessment, which, it is important to note, also contains information related to Skype for Business Online. The reason for this is that Skype for Business and Microsoft Teams store data in Exchange for the purposes of eDiscovery and data retention/archival.

I encourage you to read this article as well!

Use Exchange Online and the Security & Compliance Center to comply with SEC Rule 17a-4

Setting Up a Kali Linux Machine in Azure

A Quick Overview of Kali

One of the tools that many security professionals use on a regular basis is the Kali Linux penetration testing platform. This tool is built and maintained by Offensive Security (www.offensive-security.com), an organization that also provides extensive training on the platform and a variety of other security and penetration testing topics.

1_KaliDesktop

The Kali Linux platform is based on Debian GNU/Linux distro and contains hundreds of open source penetration-testing, forensic analysis, and security auditing tools. However, it isn’t exclusively used by traditional “red teams” and “blue teams”. In fact, it can also be used by IT admins to monitor their networks effectively (whether wired or wireless), perform analysis of data, and a variety of other tasks.

It’s important to remember that Kali Linux is NOT a static tool. Rather, you’ll likely have updates to the Kali distro on a daily basis, so make sure you perform updates before use the tool every time. (I’ll show you how in a few minutes)

Kali Linux can run on laptops, desktops or servers. You can download the ISO for Kali from https://www.kali.org/downloads, and create a bootable USB drive if you want to. But what we are doing today is running it on Azure, and this is one of the easiest ways to get started.

Let’s take a look.

Provisioning Kali on Azure

The Kali Linux distro is available without cost on Azure, but it might not be obvious where to find it. If you log in to your Azure subscription and try to provision a Kali box, you simply won’t find it in the list of operating systems or images you can deploy.

What you actually need to do is request it from the Azure Marketplace. To do this, go to https://azuremarketplace.microsoft.com/en-us/marketplace/apps/kali-linux.kali-linux . There, you’ll see a page similar to the one shown below. Click on the “Get It Now” button to request the Kali Linux distro.

2_ProvisionKali

After you request the Kali Linux machine, you’ll be asked which account you use to sign in when you request apps from the Azure Marketplace. Enter the login ID that you use for your Azure subscription.

3_AzureMktplace

Once you request the machine as described above, you’ll be able to provision the Kali box just like you would any other virtual machine or appliance. There are a couple points that should be highlighted in the description provided when you provision the box.

First, the Installation Defaults section tells us that, by default, the only way to log in to your Kali instance is by using SSH over port 22 and using either a set of SSH keys or a user-provided password. This is because the default configuration for the installation does not include a graphical user interface (GUI). The majority of the tools in Kali work just fine without a GUI, so this is the preferred way to use it, but if you are just getting started, you may want the benefit of a GUI while you figure out how the tools work and how Linux itself is set up. I’ll show you how to install the GUI later in this article. For this article, I’ll be using a username/password to log in, but again, SSH keys are more secure and would be preferred in a production environment.

Additionally, we see that it is recommended that you update the packages on your Kali machine after you deploy it. I’ll walk you through how to do that as well.

4_KaliDefaults

After you’ve provisioned your Kali Linux machine (using username and password during the initial configuration in the Azure portal), you’ll want to connect to the machine.

To do so, download and install PuTTY, or a similar SSH/telnet tool. PuTTY can be downloaded here: https://putty.org/

When PuTTY is installed, it will require you to enter the IP address of your Kali machine in order to connect. You can get the public IP address of the Kali machine from the Azure portal, as shown below.

5_IPAddress

Next, open your PuTTY client and connect to the IP address and port 22 of your Kali machine.

6_PuTTY

One thing that’s unusual about the install is that the username and password that you defined for the Kali machine when you provisioned it does NOT have root access to the machine. This means you cant make any updates or modify the install with the set of credentials you are logging in with.

Let’s fix that.

As you can see below, I’m logged in to my machine KALI-001 as the user named KALIADMIN. I now need to set a password for the root (administrator) account.

To do this, I type:

sudo passwd root

Then I define the password I want to use. That’s all there is to it!

Now I can log in as root using the command

su root

7_SetPassword

Now that I’m logged in with root permissions, I need to update my Kali machine.

To do this, simply type:

apt update && apt dist-upgrade

Type y to confirm the updates. Depending upon how many updates are available, this could take a while. For example, when I ran this command after provisioning my machine, it took about 20 minutes to get all the updates.

8_UpdateKali

At this point, you have logged in over SSH, set a password for the root account and updated the machine. However, you still are doing everything from the command line. You may want to install GUI. Basically, there are three tasks you have to perform to be able to able to manage the Kali instance the same way you’d manage a Windows server:

1. Install a GUI
2. Install RDP
3. Configure networking to allow connection over RDP

Install a GUI

Kali comes by default with the GNOME desktop package, but you need to install it.
To do so, use the command below:

apt-get install -f gdm3

Install RDP

Next, you’ll need to install an RDP package and enable the services using the commands below.

apt-get install xrdp
systemctl enable xrdp
echo xfce4-session >~/.xsession
service xrdp restart

Configure Networking to Allow Connection over RDP

Lastly, you’ll need to configure your Azure Network Security Group (NSG) to allow TCP port 3389 inbound (RDP) to your Kali machine. In the Networking section of your machine’s configuration, configure an inbound port rule for TCP 3389. Again, this is a penetration testing tool, so in a production environment, you would likely lock down the source IP addresses that can connect to this machine, but for this demonstration, we are leaving it at Any/Any.

9_NSGRules

Now that you have this set up, you should be able to connect to your Kali box using RDP, just as you would connect to a typical Windows machine. The interface for GNOME will look something like this, but it can be customized.

10_GNUDesktop

What Can I Do With It?

In the past, Microsoft required you to submit an Azure Service Penetration Testing Notification form to let Microsoft know that it was not an actual attack against a tenant. However, as per the documentation noted here, https://docs.microsoft.com/en-us/azure/security/azure-security-pen-testing, this is no longer a requirement.

“As of June 15, 2017, Microsoft no longer requires pre-approval to conduct penetration tests against Azure resources. Customers who wish to formally document upcoming penetration testing engagements against Microsoft Azure are encouraged to fill out the Azure Service Penetration Testing Notification form. This process is only related to Microsoft Azure, and not applicable to any other Microsoft Cloud Service.”

In other words, there is no strict requirement to notify Microsoft when you perform a penetration test against your Azure resources. This means that you can perform many of the standard penetration tests against your Azure tenant, such as :

  • Tests on your endpoints to uncover the Open Web Application Security Project (OWASP) top 10 vulnerabilities
  • Fuzz testing of your endpoints
  • Port scanning of your endpoints

However, one type of test that you can’t perform is any kind of Denial of Service (DoS) attack. This includes initiating a DoS attack itself, or performing related tests that might determine, demonstrate or simulate any type of DoS attack.

Thanks, Captain Obvious……

It should be obvious, but just to be clear: DON’T use your Kali machine to attack anybody else’s stuff.

You would most definitely find yourself in a legal pickle if you decided to attack resources that didn’t belong to you (or one of your customers) without explicit permission in writing. Please, just don’t run the risk.

Practice using the 600+ tools available in the Kali Linux distro and learn how to better secure your environment!

Every Question Tells a Story – Mitigating Ransomware Using the Rapid Cyberattack Assessment Tool: Part 3

In the previous two posts in this series, I explained how to prepare your environment to run the Rapid Cyberattack Assessment tool, and I told you the stories behind the questions in the tool.

https://blogs.technet.microsoft.com/cloudyhappypeople/2018/09/10/every-question-tells-a-story-mitigating-ransomware-using-the-rapid-cyberattack-assessment-tool-part-1/

https://blogs.technet.microsoft.com/cloudyhappypeople/2018/09/10/every-question-tells-a-story-mitigating-ransomware-using-the-rapid-cyberattack-assessment-tool-part-2/

Let’s finish up with the final steps in running the Rapid Cyberattack Assessment tool and a review of the output.

Specifying Your Environment

We’ve now finished all the survey questions in the assessment. Now we need to tell the tool which machines to go out and assess as the technical part of the assessment.

There are three ways to accomplish this:

Server Name: You can enter all the names of the machines you want to assess manually in the box, separated by commas, as shown below. This is only practical if you are assessing less than 10 machines. If you’re assessing more than that, I’d recommend that you use one of the other methods or you’ll get really tired of typing.


File Import: Let’s say you want to assess 10 machines from 10 different departments. You could easily do this by putting all the machine names into a standard text file, adding one machine per line.

In the screenshot below, I have a set of machines in the file named INSCOPE.TXT, located in a folder named C:RCA. This is a good way to run the assessment if the machines are spread across several OU’s in Active Directory, which would make the LDAP path method less viable as a way of targeting machines. But again, it could be a lot of typing (unless you do an export from Active Directory – then it’s super easy).


LDAP Path: If you have a specific OU in Active Directory that you want to target, or if you have less than 500 machines in your entire Active Directory and just want to target all of them, the easiest way to do that would be with the LDAP path method. Simply type the LDAP path to the target OU, or to the root of your Active Directory, as shown in the screenshot below:


NOTE:You only define your “in-scope” machines using ONE of the options noted above.

Click Next and run the assessment.


As you see, the assessment goes out and collects data about the machines in the environment, and then it generates a set of reports for you to review.


Click on View Reports to see the results of the assessment.

Notice that there are four files created. In my screenshot, you’ll also notice that the files don’t have the “official” Office icons – they just look like text files. This is because I don’t have Office installed on the Azure VM that is running the assessment. I can just copy the machines to a machine with Office installed and open them from there. But as you see, there are two Excel spreadsheets, a Word document and a PowerPoint deck. These are all created and populated automatically by the tool.


Let’s take a look at the tool’s findings.

Rapid Cyberattack Assessment Affected Nodes spreadsheet

First, let’s open the RapidCyberattackAssessmentAffectedNodes.xlsx spreadsheet.

In this spreadsheet you have several tabs along the bottom. The first tab is named “Host”, and it shows the names of the machines it was able to contact during the assessment, their operating system build version, install date and last boot-up time. All pretty standard stuff.


The second tab is for “Installed Products“, and this is a comprehensive listing of all the installed software found on the machines in the assessment. This is one way of verifying the question in the survey about whether you are keeping all your apps and middleware up to date. As you can see in my screenshot, there’s some software running on my lab machines that is several versions old, and the spreadsheet tells me which machine that software is running on. This is all stuff that could easily be collected by a network management tool like System Center Config Manager, but not every company has that kind of tool, so we provide this summary.


The third tab is the “Legacy Computer Summary”, which tells you how many of the machines in the assessment are running operating systems that are no longer supported by Microsoft. In my case, I had none. The Active Count and the Stale Count columns simply tell you whether the machine is being logged on to regularly or if perhaps it is simply a stale object in Active Directory and can just be deleted.


The “Legacy Computer Details” tab would give you more information about those legacy computers and could potentially help you determine what they are being used for.

The “Domain Computer Summary” tab is a summary of how many machines on your network are running current operating system versions.

Rapid Cyberattack Assessment Key Recommendations document

Now let’s go to the Rapid Cyberattack Assessment Key Recommendations Word document.


As you can see, this is a nice, professional looking document with an extensive amount of detail that will help you prioritize your next steps. One of the first things we show you is your overall risk scorecard, with your risk broken down into four major categories. In my case, I’ve got some serious issues to work on.


But then we start helping you figure out how to approach the problems. We show you which of your issues are most urgent and that require your attention within the next 30 days. Then we show you the mid-term projects (30+ days), and finally Additional Mitigation Projects that may take a more extended period of time, or that don’t have a set completion date (such as ensuring that the security of your partners and vendors meets your security requirements). By giving you this breakdown, a list of tasks that could seem overwhelming (such as what you see in my environment below) is somewhat more manageable.


We then get more granular and give you a listing of the individual issues in the Individual Issue Summary.

You’ll notice that each finding is a hyperlink to another location in the document, which provides you with a status on the issue, a description of the issue, it’s potential impact and (for some of the issues) which specific machines are impacted by the issue.

This is essentially the comprehensive list of all the things that should be addressed on your network.

So how do you track the progress on this?

Excel Resubmission Report spreadsheet

That’s the job of the Excel Resubmission Report.xlsx file. This file is what you would use to track your progress on resolving the issues that have been identified. In this spreadsheet you have tabs for “Active Issues” (things that require attention), “Resolved Issues (things you’ve already remediated) and “Not Applicable Issues” (things that don’t apply to your environment).


This spreadsheet is a good way for a project manager to see at a high level what progress has been made on certain issues and where more manpower or budget may need to be allocated.

Rapid CyberAttack Assessment Management Presentation PowerPoint deck

This is the deck – only a few short slides – that provides a high-level executive summary of all the things you identified and how you intend to approach their resolution. This is a very simple deck to prepare and can be used as a project status update deck as well.


Every Question Tells a Story

So that’s the Rapid Cyberattack Assessment tool in its entirety. It isn’t necessarily the right tool for a huge Fortune 100 company to use to perform a security audit; there are much more comprehensive tools available (and they usually are quite expensive, which this tool is NOT).

But for the small-medium sized businesses who simply want to understand their exposure to ransomware and take some practical steps to mitigate that exposure, this tool is a great starting point.